Here I briefly describe my experiences with carbon printing.
An interesting property of printed ink
In the process of calibration of an ink set for use with Quad Tone Rip (QTR) one has to print an ink separation file which prints different amounts of ink for each ink channel (21 or 51 steps each). Thereafter, one can measure the ink patches with different ink amounts. I noticed an interesting property (most likely very well known to professionals) which I have not found in any guide for or discussion about QTR: The lightness L (visual lightness, I dropped the asterisk for convenience) of an ink as a function of the amount of ink laid down on the paper is almost exactly decaying exponentially with K. I think for this to be true the ink droplet size should be constant. Therefore, I use the highest available print resolution in QTR. The same functional dependence has been found more than 150 years ago for the attenuation of the radiation intensity with depth as it penetrates into an absorbing medium. In physics this dependence is known as the Beer-Lambert law.
In printing, we do not want to have an exponential decay of the lightness as a function of the ink amount. We want to have a linear decay of L with key variable K! However, knowing the exponentially decaying function allows to make a mathematical transformation of the lightness function such as to predict the ink amount that would be required such that the lightness of the printed target depends linearly on K. If there would be no error sources and if the dependence of the lightness as function of the ink amount could be exactly described by a mathematical formula, one could construct a quad file which would print exactly linear. Ideally, there would be no need for trial and error setting the densities and ink limits in the QTR curve creator tool and there would be no need for an additional linearization step.
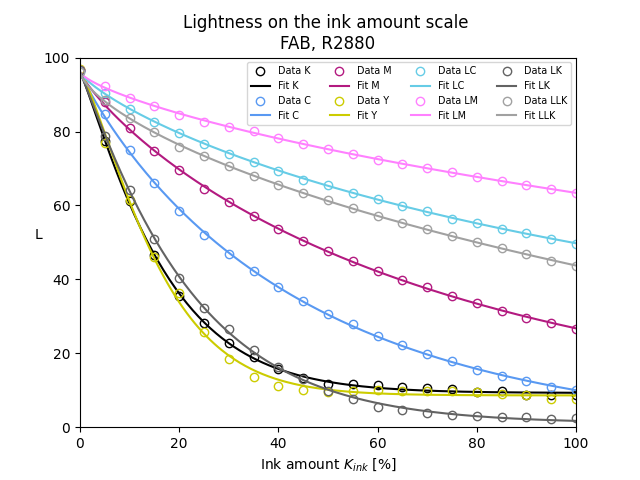
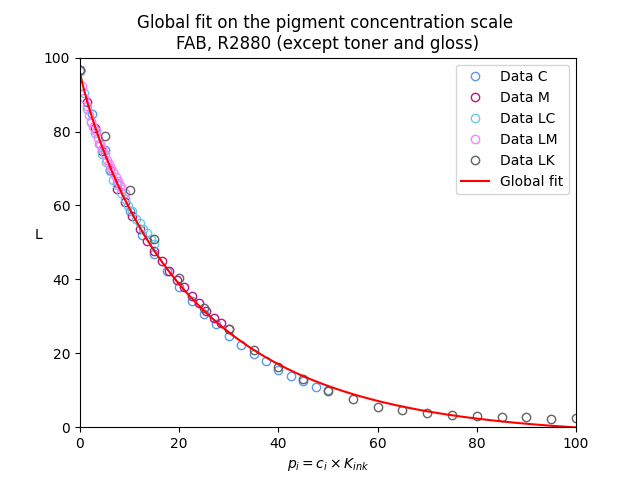
In reality, things are a little bit more complicated: The dependence L(K_ink), where K_ink is the ink amount, is not exactly exponential, but can still be fitted very accurately by some slightly modified functions. The lightness functions also depend on the paper and its surface structure. Furthermore, the lightness that is being printed by my R2880 is not always exactly reproducible and the lightness measurement device (ColorMunki Photo) has some error as well. Yet, the approach has worked nicely for me. Figure 1 shows an example for Hahnemühle FineArt Baryta and the GCVT ink set of Paul Roark using a 21 step wedge. By scaling the L(K_ink) data for individual ink channels (fig. 1a) with the pigment concentration c_i all lightness curves can approximately be matched (fig. 1b).
|
|
Creating quad files
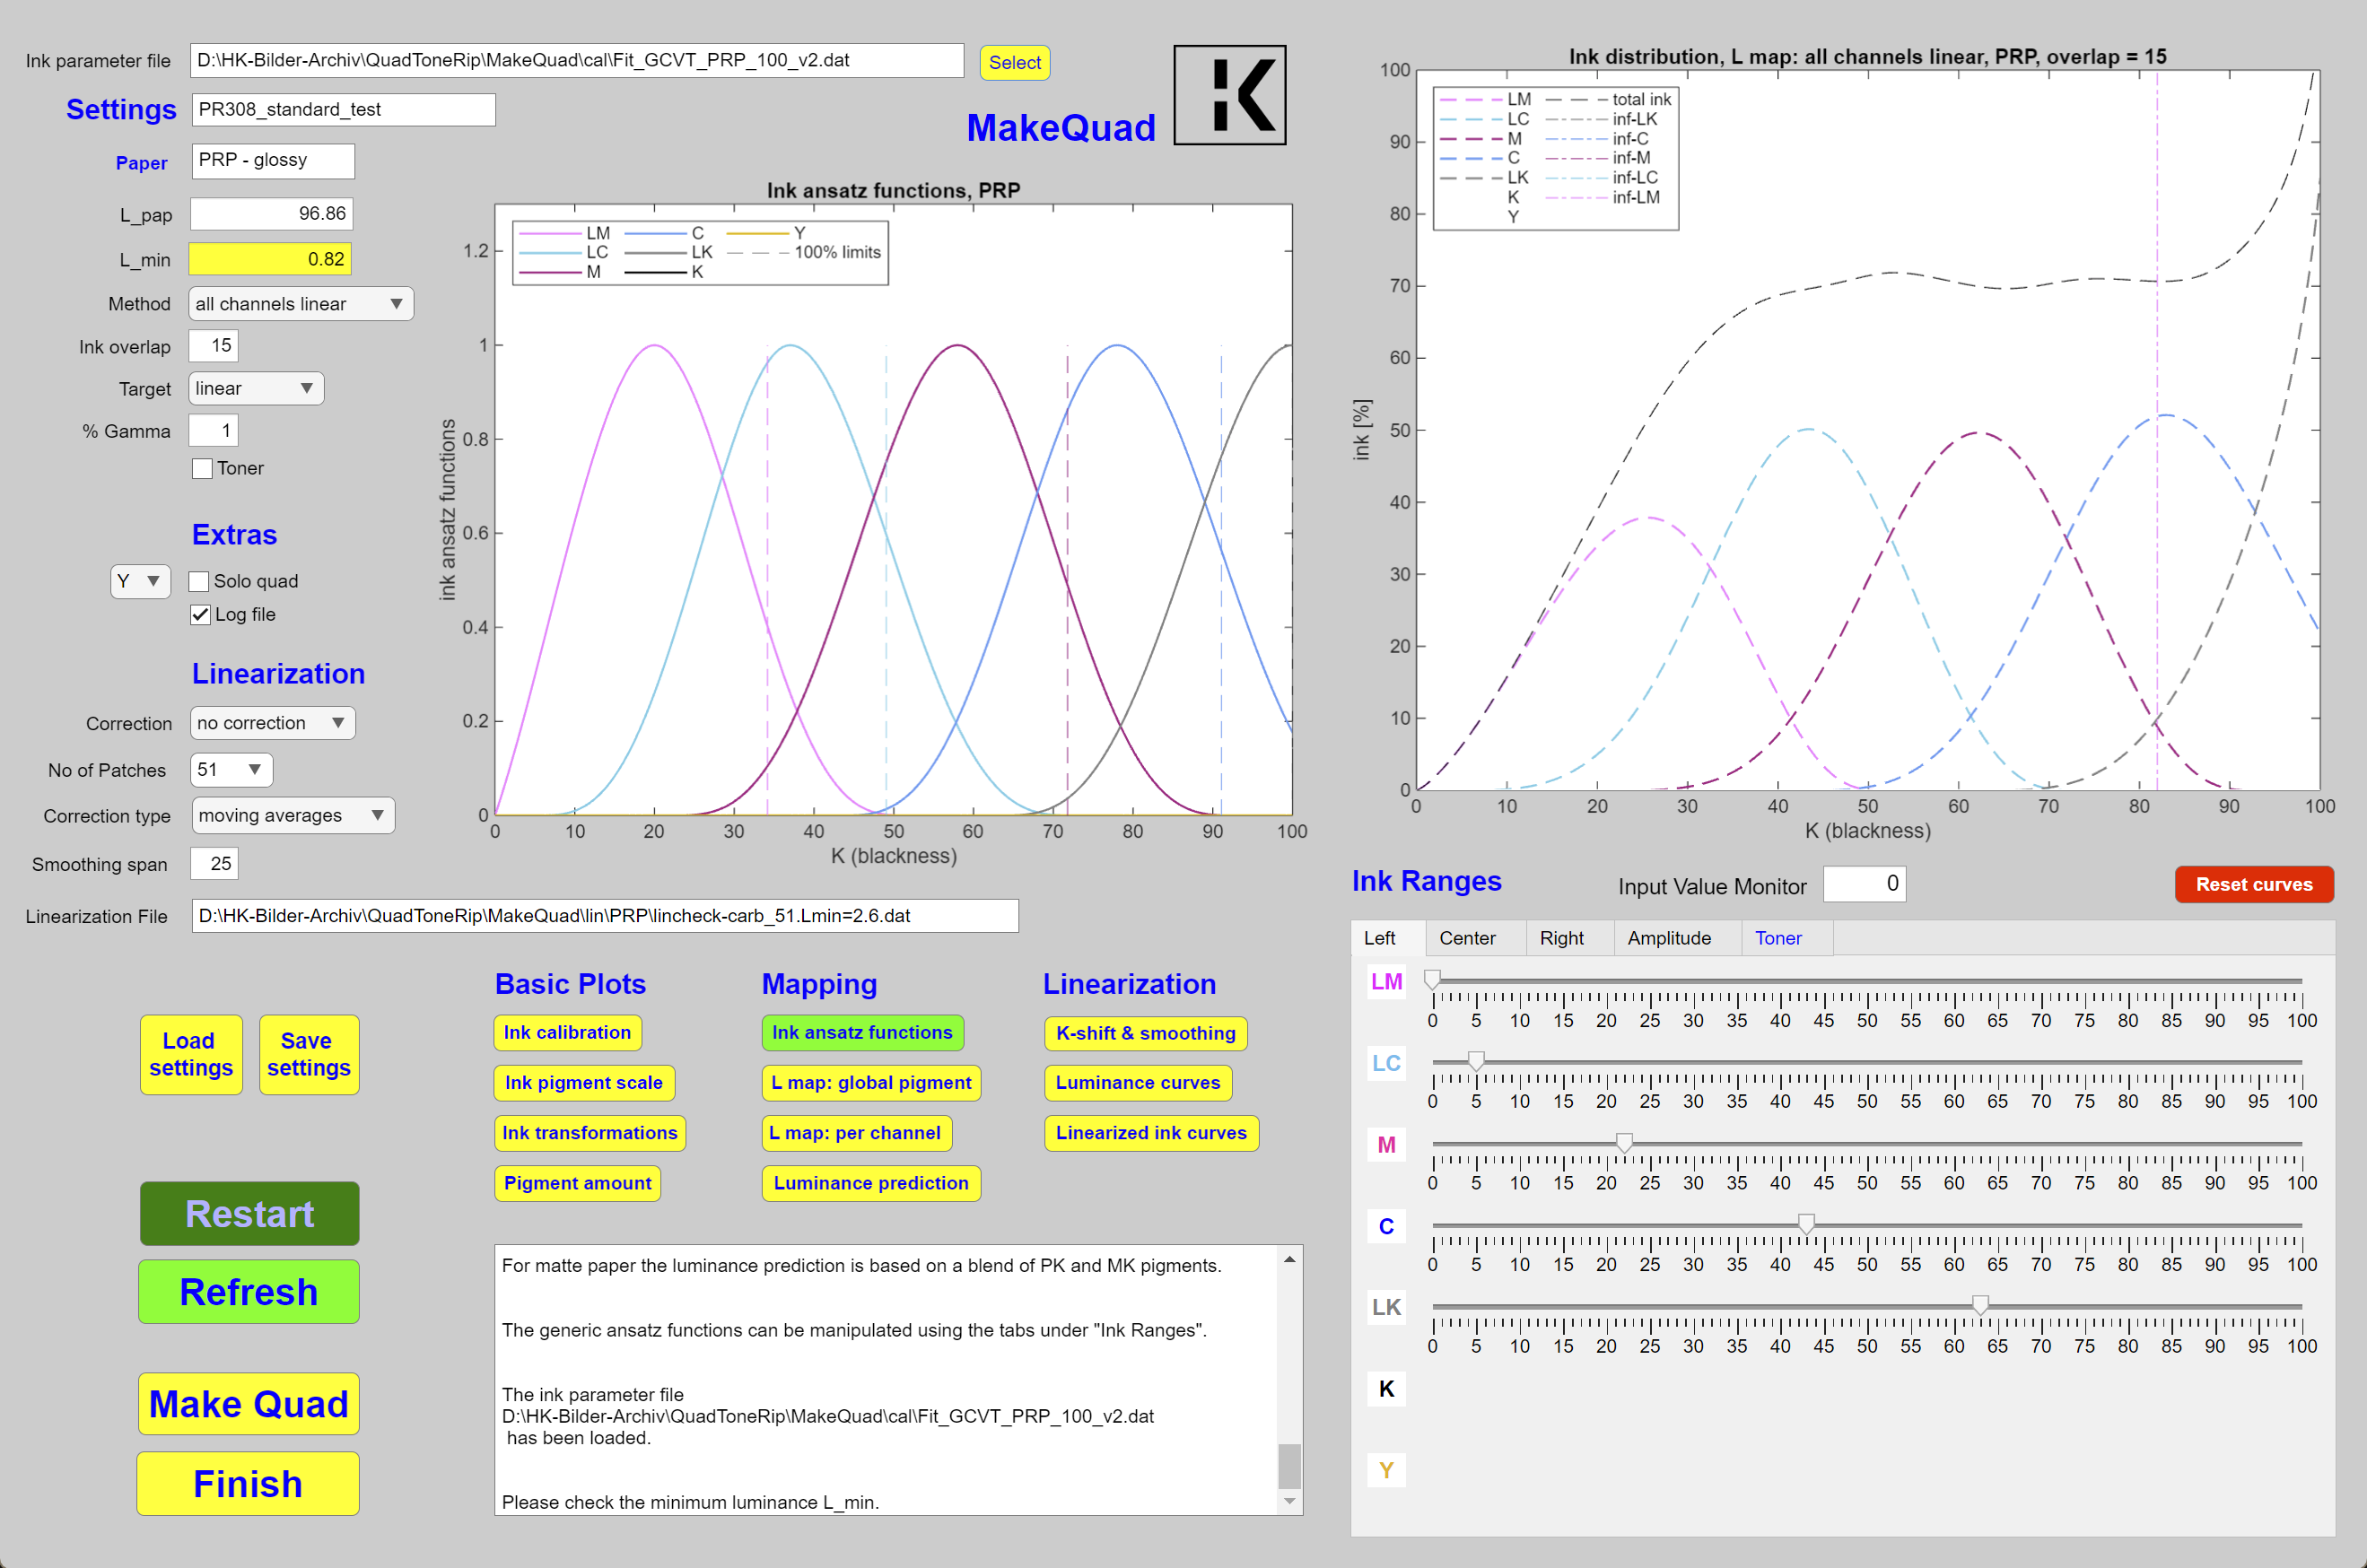
The above property of the inks can be used to transform the lightness function(s) to linear function(s) and to partition the inks for printing. This can be accomplished by suitable ansatz function which are positive and normalized to 1 and which determine the ink amount. In order to have smooth functions I use ansatz functions whose values and slopes vanish at the end points. They are similar, if not equal, to the original Piezography curves (before 2017). An example for the ansatz functions can be seen in the left plot of of figure 2. The figure shows the graphical user interface of MakeQuad, a program to create quad files based on the above approach which can then be used in QTR for printing. An important parameter is the range of overlap of the ansatz functions. It may happen that the lightness seems to be perfectly linear when measuring the patches of a 21 step wedge. But if a bull's eye is printed one may recognize that the transitions between ink is not smooth enough. In that case an increase of the overlap between the ranges in which the individual inks print can solve the problem. Apart from the global ink overlap parameter in the GUI one can set the range of any ansatz function (left and right points) as well as the location of the maximum (center point) for each ink. The program then updates all ink functions (right window) such that the printed output is linear, up to errors due to the uncertainties mentioned above. Version 2.6 of MakeQuad has even more features.
Printing glossy and matte
Currently I am using the GCVT ink set of Paul Roark. This ink set is essentially made from glossy inks based on PK ink with one channel being occupied by matte black ink (MK). This configuration allows to print on glossy as well as on matte papers. When printing on glossy paper, only inks are involved which are dilutions of the same black PK ink. As shown above the lightness functions for all dilutions of the PK ink can be mapped to one and the same curve by a simple scaling of K proportional to the concentration of PK black in the individual (gray ink) dilutions. This allows a global mapping of all inks to a linear lightness curve, based on the amount of pigment.
When printing on matte paper, the MK channel has to be used for the darkest tones. The PK black ink cannot achieve true blacks on matte paper. On matte paper the lightness of the PK channel saturates at K ≈ 93. Therefore, one cannot find a simple scaling of K such that all lightness curves fall on the same master curve. This would only be possible if the gray inks for matte paper would all be dilutions of the same MK black ink. Obviously, this is the price to pay for the flexibility to print glossy as well as matte with the same ink set. In this situation, one possibility is to linearize all channels individually and combine them according to the basic ink ansatz functions. The specific approach provides limitations for each ink channel, because the ink amount necessary for achieving the predefined linear lightness will diverge at some K, since the brighter inks cannot produce the darkest tones. Therefore, the use of those inks which are based on PK (these concern all inks except for the MK black channel) should not exceed a certain value of K which is specific for each ink. In particular, the PK channel which prints a dark gray on matte paper cannot be used up to K=100 when linearizing each channel. As a result, the darkest tones (K > 93) must be printed only using only one ink, the MK ink. Theoretically this could perhaps cause a little graininess in the darkest areas of the print. But I think this will not be visible under normal view conditions. If one wants to use the PK ink up to K=100 one would have to give up the automatic linearity of the resulting lightness L(K) and find a different approach. Another remedy would be to use the Y channel (which originally also contains MK ink for printing on Arches watercolor paper) loaded with a slightly diluted MK ink. This idea is perhaps not too bad.
Lightness prediction
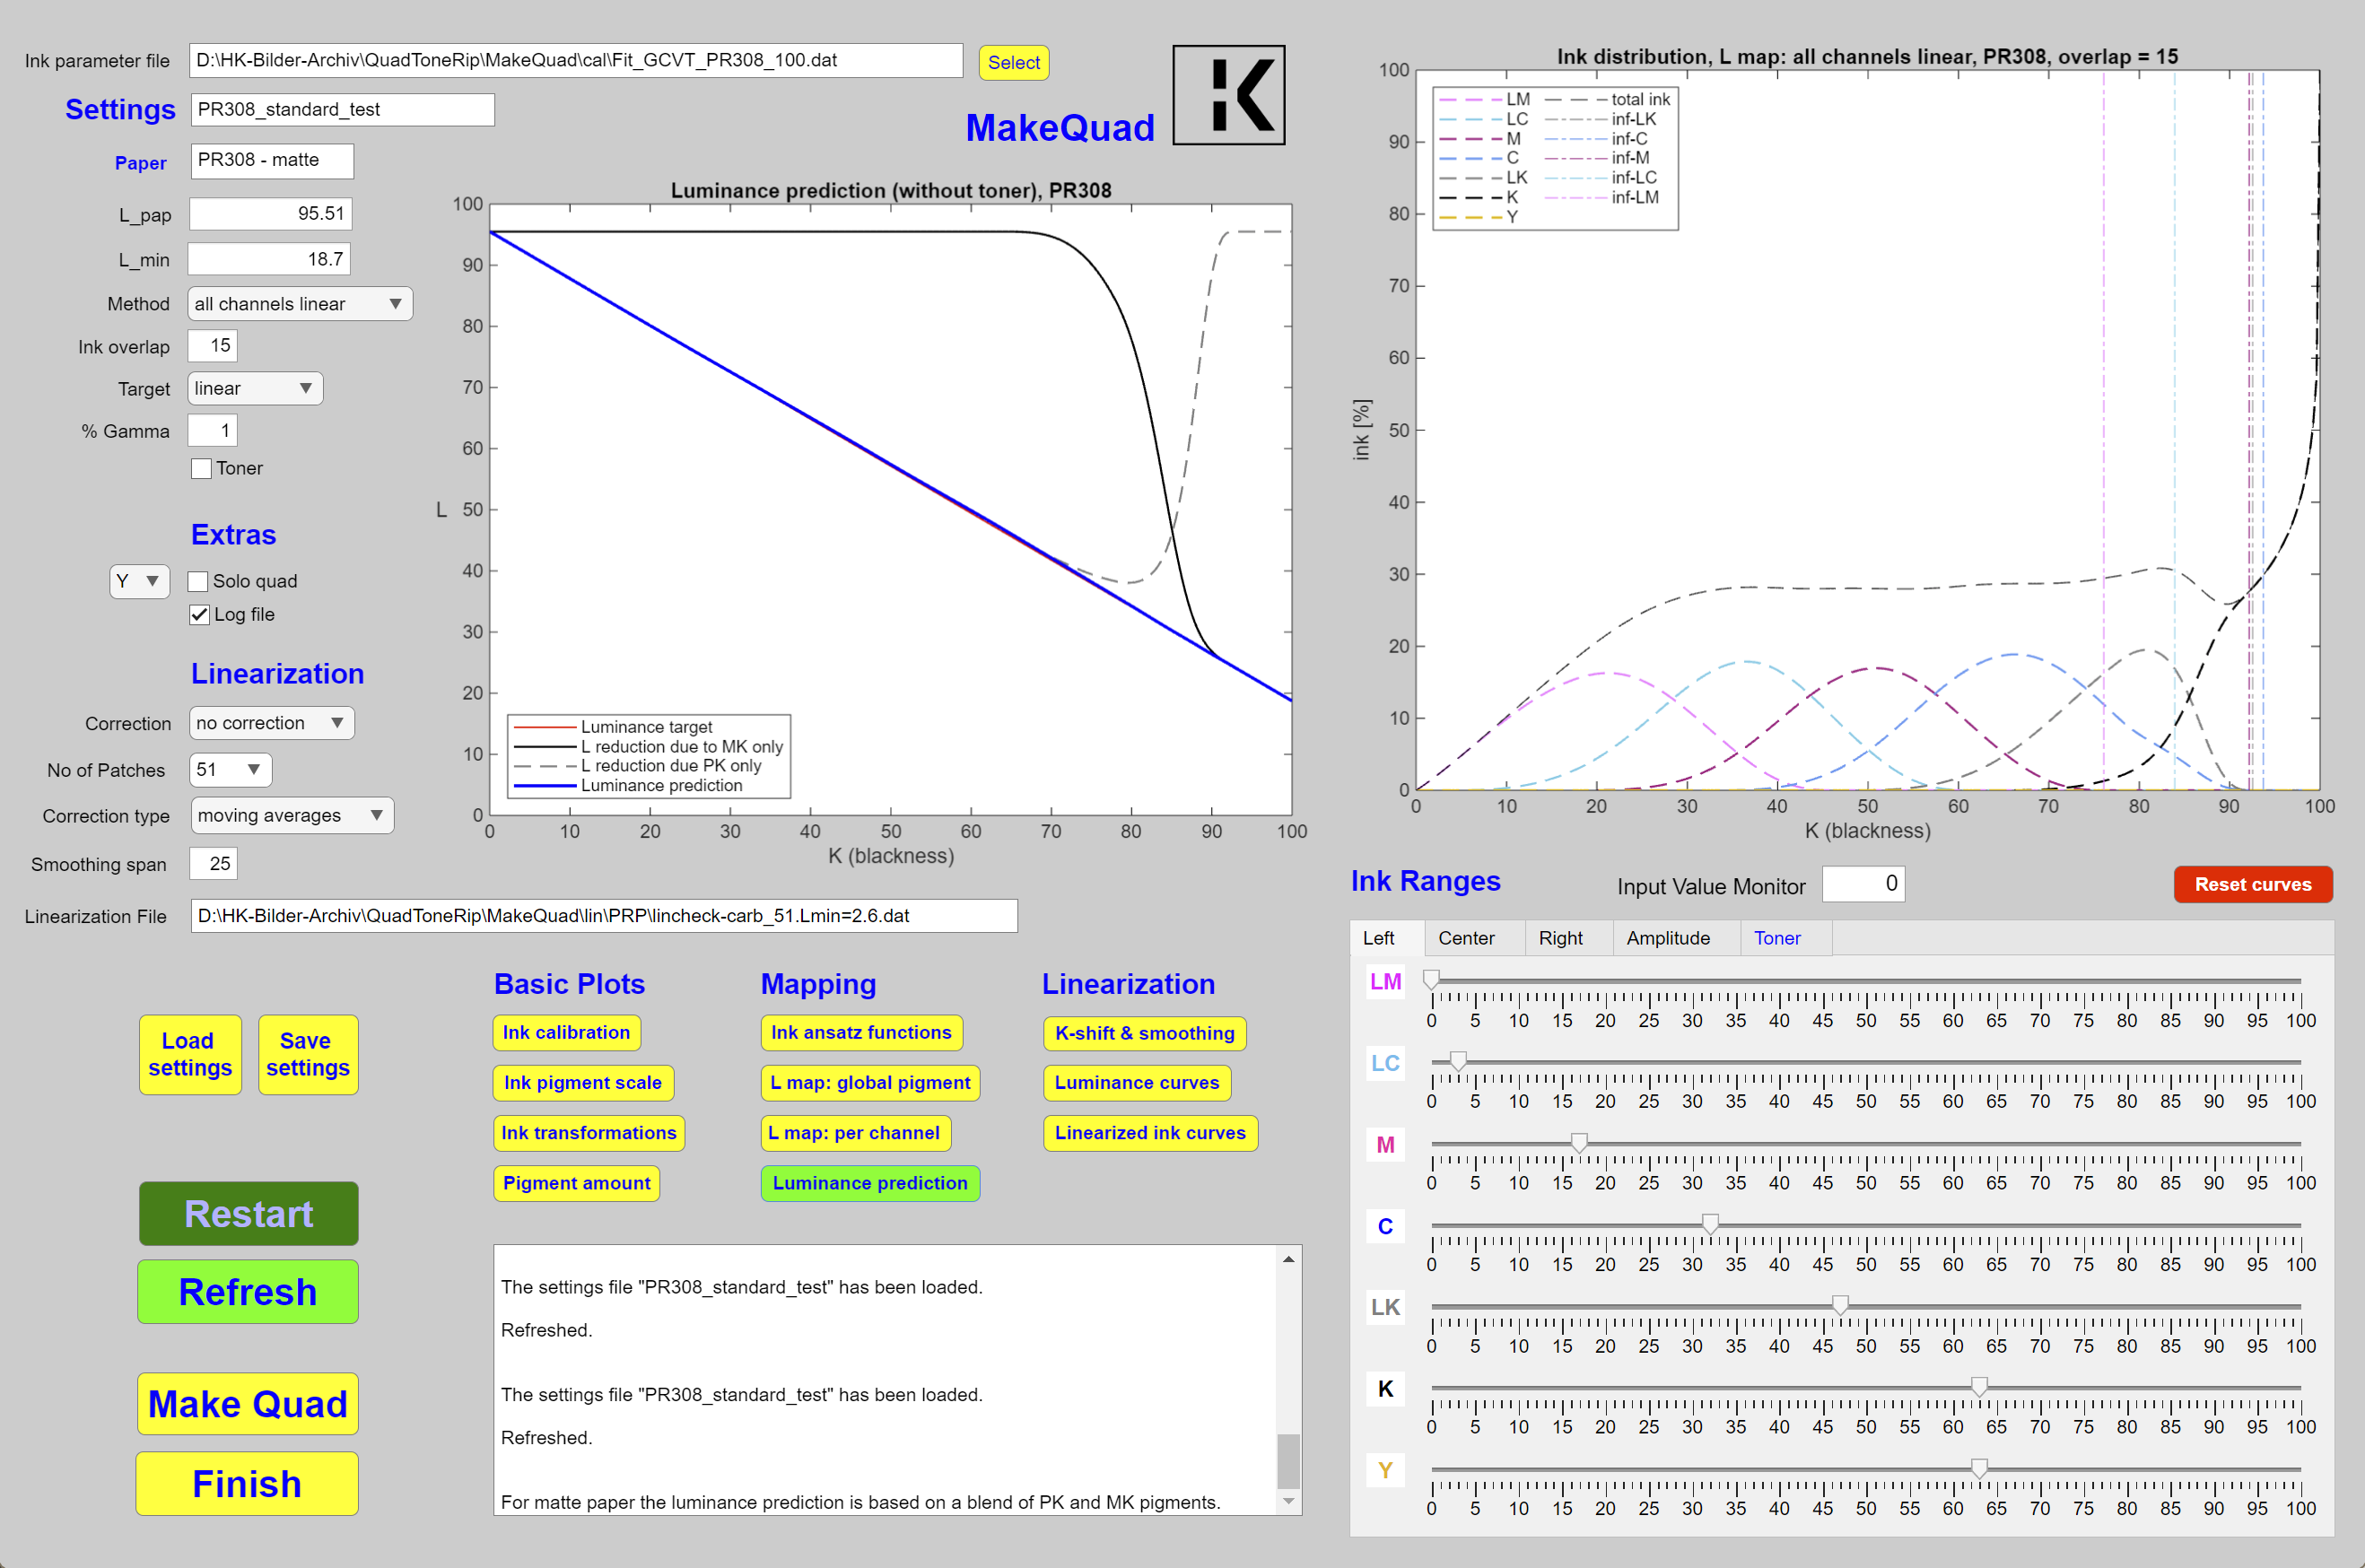
If one gives up on the automatic linearization in order to use the PK inks on the full K scale the question arises: How should the inks be combined? To find a suitable ink distribution I use a lightness prediction which is based on the properties of the PK and MK inks and also of the toner ink which is in the LLK channel for the GCVT ink set. To be able to predict the lightness one first has to figure out the pigment coverage as a function of the ink amount used separately for PK, MK and the toner ink. Once the pigment coverage is established one needs to consider the random superposition and the probabilities to find within a pixel no pigment particle, a pigment particle of one kind, two pigment particles from different inks and finally a combination of all three types of pigment particles. This way one can come up with a superposition formula which can not only predict the lightness of a certain pure carbon ink distribution on glossy paper, but also the lightness of a neutralized ink distribution including a toner ink on matte paper. I was very surprised how good the prediction is. Only later I became aware that the same equations have been derived before by Demichel (1924). One example is shown in the left frame in fig. 3. Without a toner the red curve would almost reproduce the green target curve. The linearity has been confirmed by measuring a printed step wedge. But if a toner is used (as in the figure) the lightness in the mid-tones is too low and one has to linearize.
Toning
The GCVT ink set contains a blue channel which has been designed by Paul Roark to eliminate the the brownish tint the pure carbon inks show, in particular on glossy paper. I have no idea for a theory which would allow to eliminate the tint in a single step similar as the mapping of the carbon inks. Therefore, one still has to iterate to find the necessary amount of blue ink in order to arrive at an almost neutral gray throughout the full K scale. An example is visible in the right frame of fig. 3, where the light light gray (LLK) curve shows the amount of toner ink for Arches 88. Currently the amount is computed by cubic spines based on 11 control points shown as circles which can be manipulated by changing the sliders below the graph.
Linearization
It may happen that the targeted linear curve is not perfectly obtained by the mapping. When using the pigment mapping a possible reason could be that the lightness curves deviate somewhat from the average fit (red line in fig. 1b) on which the mapping is based. For that reason a linearization is implemented in MakeQuad similar as in the curve creation tool of QTR, based on a measured step wedge. Furthermore, one can select among different smoothing options for the measured deviation from linearity (piecewise linear, 6th-order polynomial fit, moving averages). The default smoothing is a running average with a window of 25 points.
Target: Gamma correction
Since it is possible to map the exponential lightness functions to a linear function, they can also be mapped to any lightness curve one desires, provided the targeted curve is strictly monotonous (bijective). Since the linear mapping typically yields printed images with quite bright shadows, the targeted lightness function L(K) should deviate somewhat from the linear lightness curve in order to obtain a good match between the visual appearance of the print and the image seen on the screen. Let me call this correction a gamma correction. For this purpose Paul Roark provided a Photoshop correction curve to prepare a modified tif file which then appears to dark in Photoshop, but prints correctly using QTR. Using MakeQuad the gamma correction can automatically burned-in into the quad file. To that end I use a formula which can almost perfectly reproduce the lightness printed by the Epson driver of the P900 with the standard settings. The GUI allows to control the amount of the gamma correction. Furthermore, it is possible to create a quad file for just any other bijective user-defined lightness target curve.
June 2025, December 2025, July 2026